GSoC 2023 Final Report
Published: Sun Sep 24 2023
I worked on a project titled Search Pages for Internet Yellow Pages with the Internet Health Report (IHR) organization.
Internet Yellow Pages (IYP) is a knowledge graph (a Neo4j graph database) for Internet resources. You can visualize IYP data on IHR with the IYP Views tool (select tools -> IYP Views in the top menu). Entities like Autonomous Systems (ASes), Internet Exchange Points (IXPs), and Prefixes can be visualized through IYP Views. For example, an Autonomous System (AS) will connect with other Autonomous Systems (ASes) to exchange network traffic. Those kinds of relationships can be visualized through IYP Views. I have given a simple example. IYP is capable of doing more than this.
Improved Network Monitoring using IYP Views
IYP is a graph database that has useful data on internet entities. But there is a lack of tools to visualize the data. The goal of the project, “Search Pages for the Internet Yellow Pages,” is to create a visualization tool. IYP Views is a visualization tool for entities like Autonomous Systems, Internet Exchange Points, Prefixes, and more.
My Work
Here is my work that I made during the GSoC coding period:
- Wrote a plugin to establish a connection between the client and the database.
- Ideated with mentors to create 4 pages initially (AS, Country, IXP, and Prefix) along with discussions on the data to be visualized and started working on the AS page.
- Ideated and came up with a design to fetch data
- Implemented parallelism to fetch data parallelly for every expansion item using Promises. I wrote the necessary methods in the plugin.
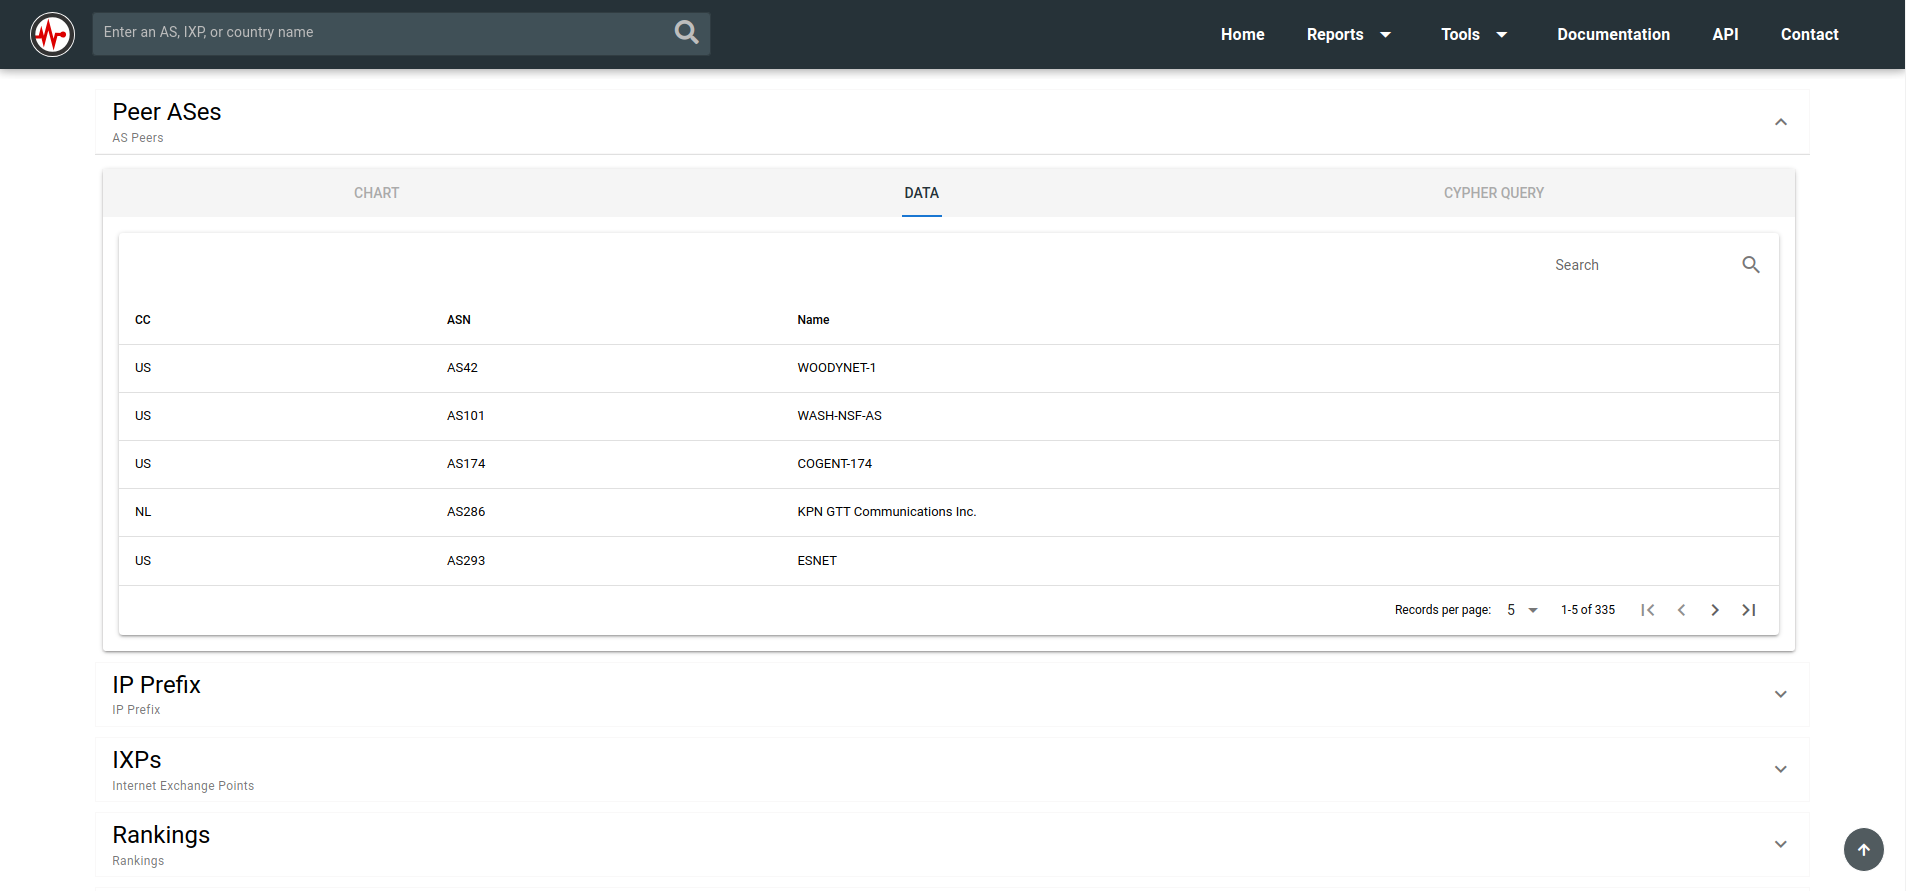
- Implemented an auto-complete search bar to search for an AS with an ASN (e.g., AS2497) or the name of the AS (e.g., Internet Initiative Japan).
- Implemented pages for country, IXP, and prefix
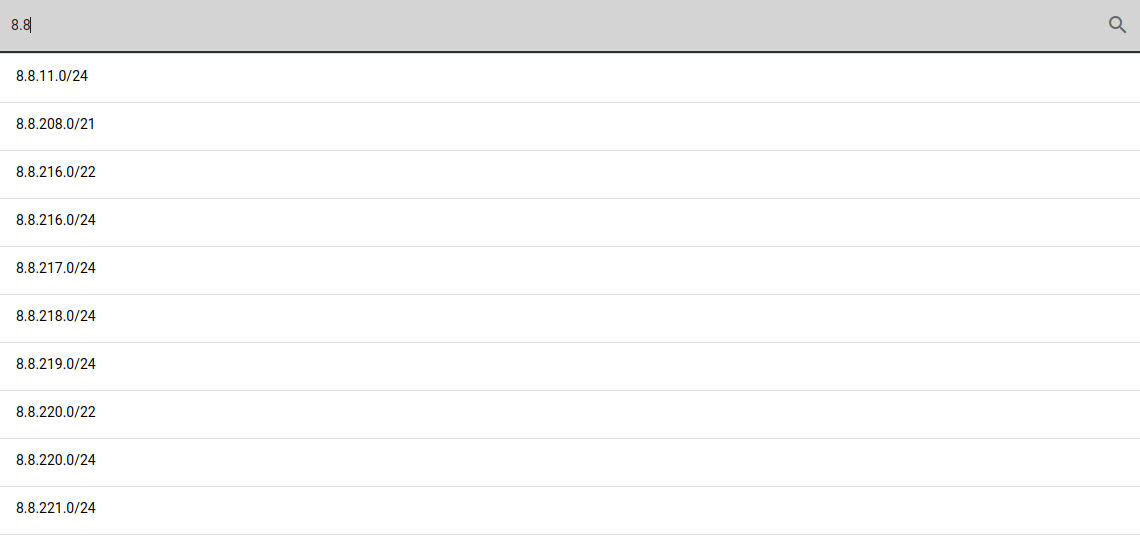
- Extended the search bar to search for country (e.g., Japan), IXP (e.g., Equinix Sydney), and prefix (e.g., 8.8.8.0/24)
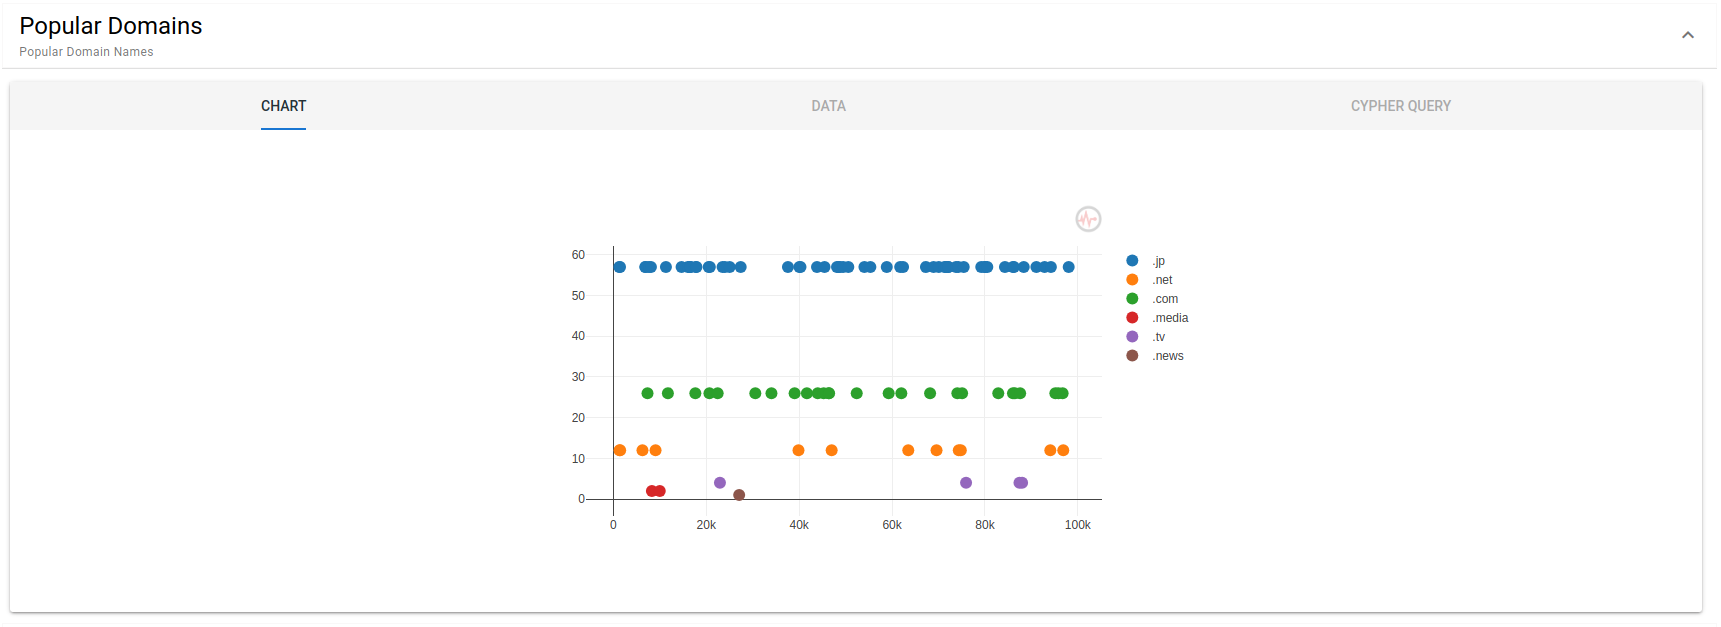
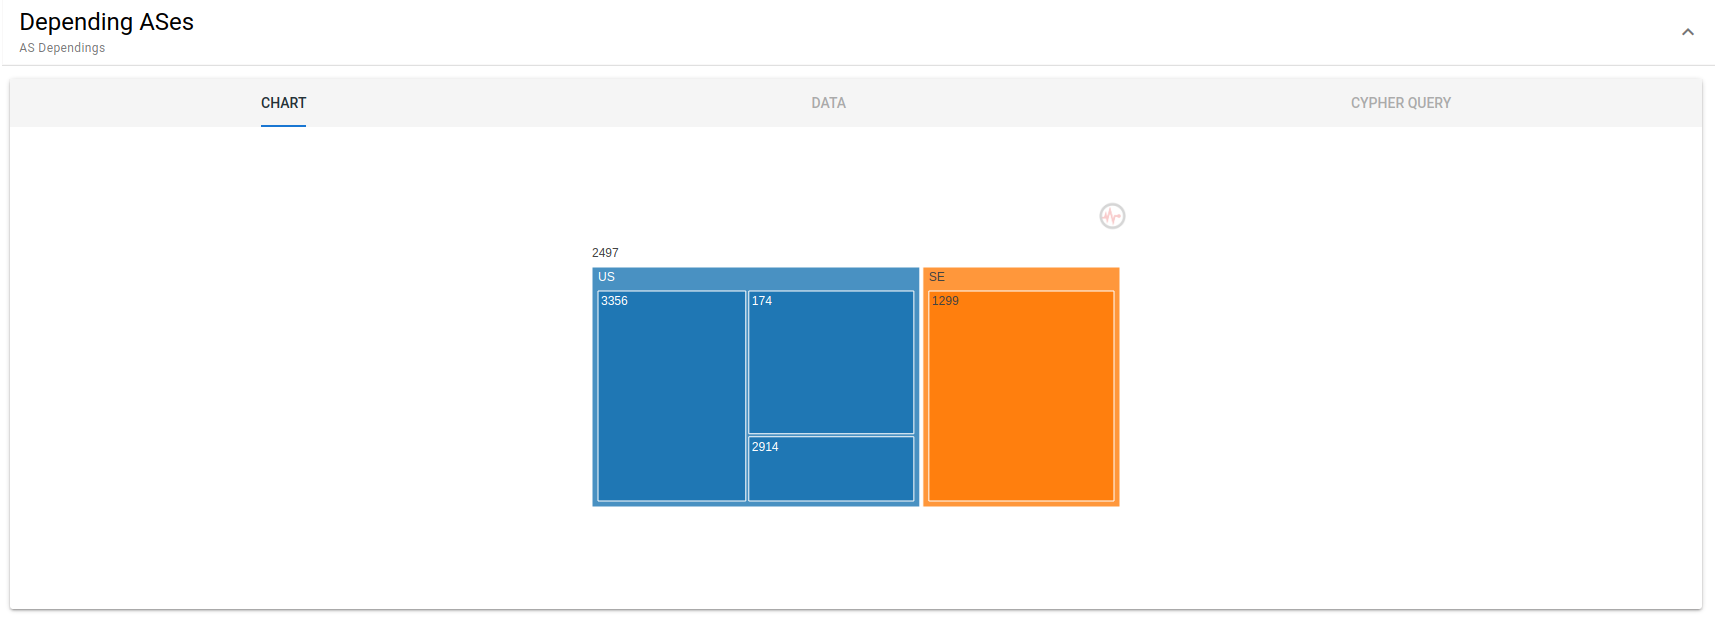
- Implemented plug-and-play charts (bar, pie, treemap, hover events, and more) using Plotly.
- Found a room for optimization in data fetching. Implemented fetching of data and rendering the components on click of the expansion item instead of fetching all the data at once in parallel.
Current State
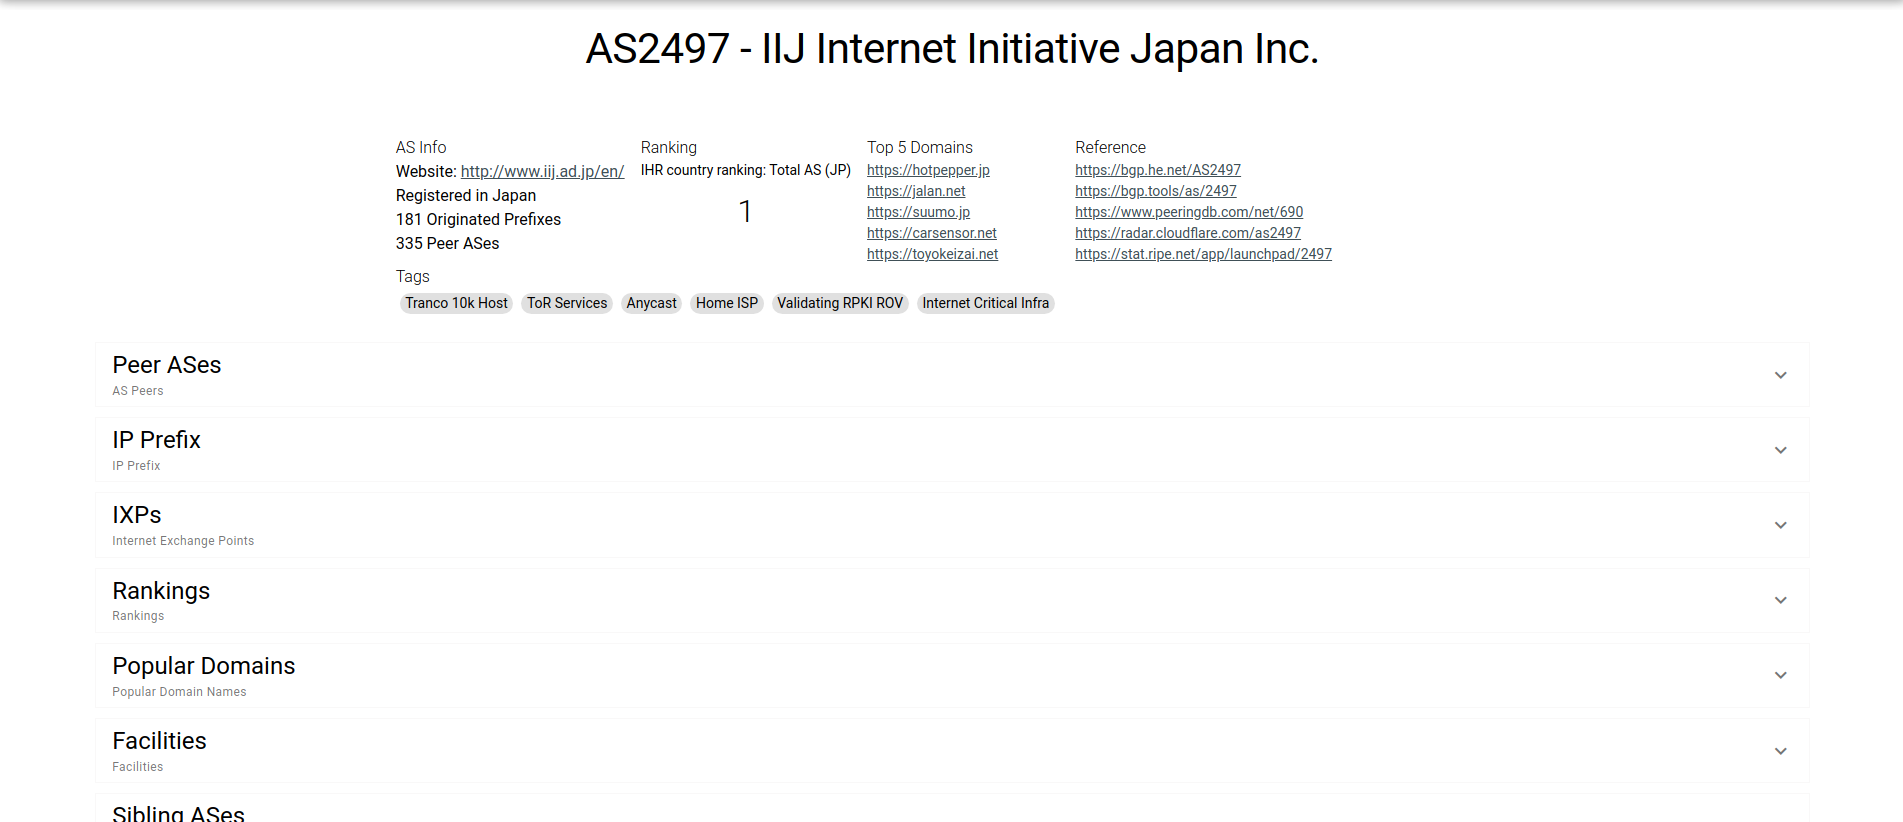
There are 4 pages at the time of writing this byte, namely AS, Country, IXP, and Prefix. For example, the following parameters can be visualized on an AS page using IYP Views:
- Prefixes
- Internet Exchange Points (IXPs)
- The rank of an AS (APNIC, Eyeball, etc.)
- Popular domains of an AS
- Peers and Siblings of an AS
- Dependent and Depending ASes
Here’s the data visualization for originated prefixes by AS2497:
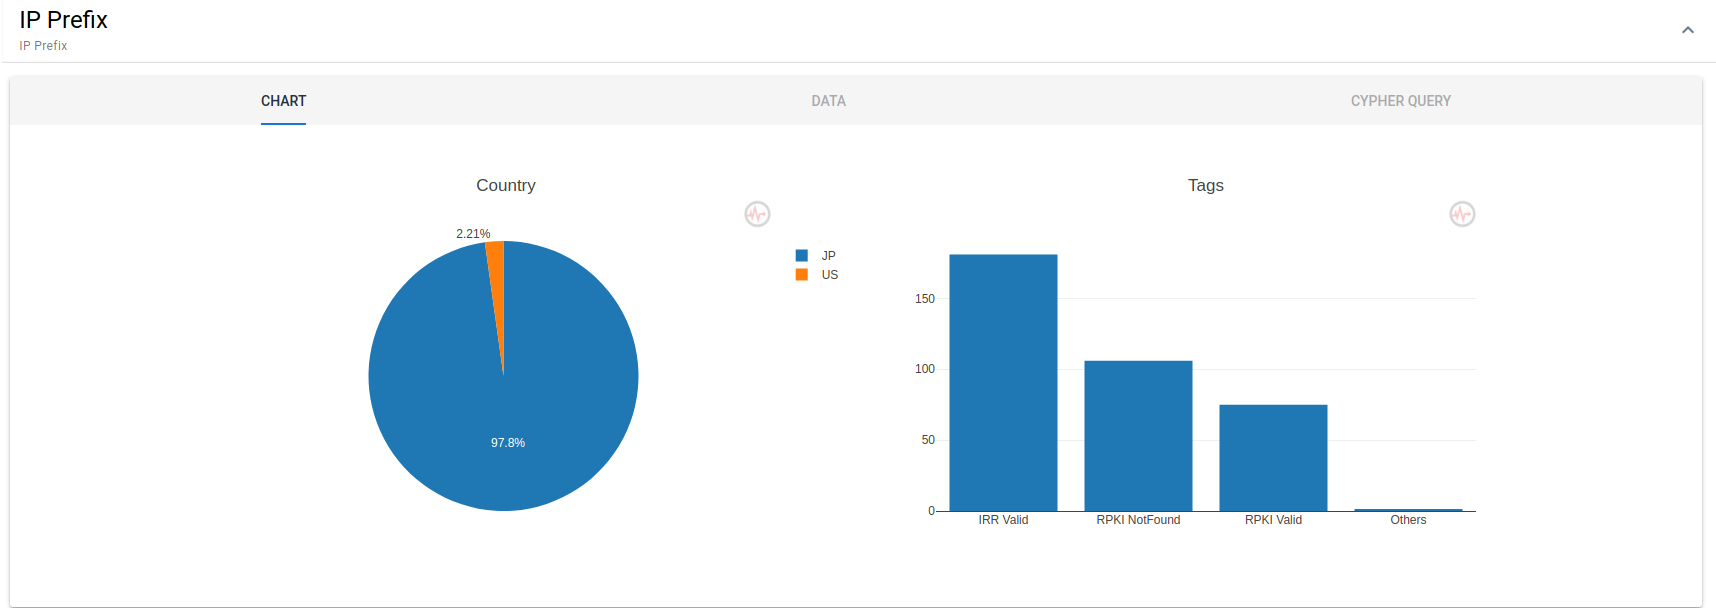
Similarly, the data can be visualized specifically for other pages (country, IXP, and prefix). Visit the documentation to learn more about the data visualization part.
What’s left to do?
The milestones mentioned in the proposal have been completed, except there is work left to do in documentation. That, too, will be completed ASAP.
What code got merged?
My work is in a dedicated branch named iyp-integration and it will get merged in a few days. Also, you can view a list of PRs I’ve done.
Final thoughts
Thanks to my mentors, Mr. Romain and Mr. Malte. They created a friendly environment for me to discuss and ask questions. The experience I got from working on an open-source project taught me a lot.